Momentum Oscillator & Rate of Change
◙ Prime Use: Identifying the Trend
◙ Trading: Detecting weak trends and likely reversal points
◙ Standard Settings: 14, 21, 63, 125, 250 Periods
![]() Introduction to the Momentum Oscillator
Introduction to the Momentum Oscillator
The Momentum Oscillator measures the difference between the latest closing price and the closing price T periods ago. The result is a series that oscillates around a horizontal equilibrium line (the zero line), which represents the level where the price remains unchanged over the selected time period.
Momentum is closely related to the Rate of Change (ROC) indicator and generally generates identical trading signals.
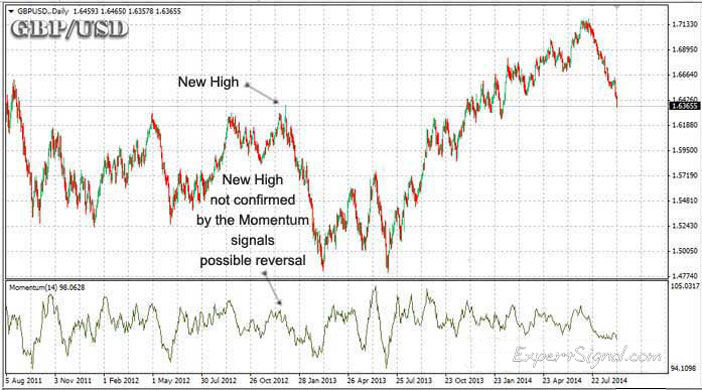
Chart: Momentum Oscillator on GBP/USD
![]() Calculating the Momentum Oscillator
Calculating the Momentum Oscillator
The formula for calculating the Momentum Oscillator is:
■ Momentum = Closing Price – Closing Price (T periods ago)
![]() Trading with the Momentum Oscillator
Trading with the Momentum Oscillator
Although considered a simplistic indicator, the Momentum Oscillator can still offer valuable insights:
-
It helps detect weakening trends and potential reversal points
-
High values (positive or negative) indicate strong momentum
-
Low values indicate possible trend exhaustion or early signs of a new trend
-
It can be used in both trending and ranging markets
-
Divergences between Momentum and the price chart often provide more reliable trade signals
![]() Platform Setup
Platform Setup
You can install the Momentum Oscillator directly in MetaTrader-4 or MetaTrader-5:
□ GO TO → INDICATORS → OSCILLATORS → MOMENTUM
□ SETTINGS → 14 PERIODS

![]() Rate of Change (ROC)
Rate of Change (ROC)
The Rate of Change (ROC) measures the percentage change between the current price and the price from a specific number of periods ago. For instance, ROC over 21 days measures the change over roughly one trading month.
Trading Year Breakdown
-
250 trading days per year
-
125 trading days per half-year
-
63 trading days per quarter
-
21 trading days per month
Note: Trend reversals typically begin in shorter timeframes and then extend to longer ones.
![]() How ROC Defines the Long-Term Trend (Bull vs Bear Conditions)
How ROC Defines the Long-Term Trend (Bull vs Bear Conditions)
-
Bullish: If ROC(21) and ROC(63) are above both ROC(125) and ROC(250), the market is considered to be in a long-term bullish trend.
-
Bearish: If ROC(21) and ROC(63) are below both ROC(125) and ROC(250), the market is considered to be in a long-term bearish trend.
![]() Calculating ROC
Calculating ROC
■ ROC = [(Current Close – Close 'n' periods ago) / Close 'n' periods ago] × 100
■ Momentum Oscillator and Rate of Change (ROC)
ExpertSignal.com ©

Read More at ExpertSignal
| ■ COMPARE PROVIDERS | ► Forex Accounts | ► Trade Signals | ► Crypto Exchanges | ► Volume indicators | ►Trend Indicators | ||
| ■ OSCILLATORS | » INTRODUCTION |
» MACD |
» RSI |
» CCI |
|||
| » Momentum |
» ADX |
» DeMarker |
» Awesome |
» Gator |
|||
| » RSI PRECISION |


