Standard Deviation (SD or 'σ')
◙ Primary Use: Measuring Market Volatility
◙ When Trading: Confirming Price Reversals
◙ Typical Settings: 20/21 Periods
![]() Introduction To Standard Deviation
Introduction To Standard Deviation
Standard deviation is a widely used statistical tool for measuring market volatility.
- Its symbol is the Greek letter sigma (σ).
Standard deviation is based on the concept of normal distribution, where values tend to cluster around a central average over time.
Understanding Standard Deviation
-
A higher standard deviation indicates greater variability in data values.
-
A lower standard deviation indicates less variability and more consistency around the mean.

![]() How to Calculate Standard Deviation
How to Calculate Standard Deviation
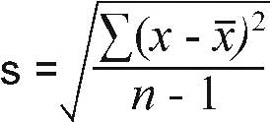
To calculate standard deviation:
-
Calculate the mean (average) of the data set.
-
Subtract the mean from each data point and square the result.
-
Sum all the squared deviations.
-
Divide the sum by the number of periods.
-
Take the square root of the result to get the standard deviation (σ).


![]() Trading with Standard Deviation
Trading with Standard Deviation
Standard deviation should not be used alone as a trading signal generator. Instead, use it to:
-
Forecast potential price reversals, based on the idea of mean reversion.
-
Confirm signals from other technical indicators, especially for price reversals.
-
Assess market risk and adjust your money management strategies accordingly.
![]() Platform Setup
Platform Setup
To add Standard Deviation in MetaTrader:
-
Navigate to: INDICATORS → TREND → STANDARD DEVIATION
-
Use the default or set to: Period: 20 or 21
Summary: Using Standard Deviation
Standard Deviation is a powerful technical analysis tool for gauging volatility and supporting trading decisions—especially when used with other technical indicators.
■ What is Standard Deviation?
ExpertSignal.com
Read More at ExpertSignal » Ichimoku
■ COMPARE PROVIDERS
► Forex Accounts
► Trade Signals
► Crypto Exchanges
► Volume indicators
► Oscillators
■ TREND INDICATORS
» Introduction
» Moving Averages
» Fibonacci


