
Candlestick patterns are specific price formations identified on a candlestick chart. These patterns are useful tools for forecasting future price movements, especially trend reversals.
Introduction to Candlestick Patterns
Candlestick patterns can be recognized manually or automatically using specialized software.
Candlestick Formation
A single candlestick shows the high, low, opening, and closing prices for a trading period. Each candlestick includes:
(i) A Body, reflecting the opening and closing prices.
(ii) Shadows (or wicks/tails), reflecting the highest and lowest prices during the period.
-
Bullish candlesticks are colored White or Green.
-
Bearish candlesticks are colored Black or Red.
Key Recognizable Candlestick Patterns:
The Doji pattern is a very common formation found in the charts of many different financial assets (Forex, commodities, bonds, etc.). A Doji candlestick looks like a cross and usually appears after a strong movement. It is characterized by an identical opening and closing price. There are four common Doji pattern types:
-
Common Doji (like a cross)
-
Long-Legged Doji (like a long cross)
-
Dragonfly Doji (like a pin)
-
Gravestone Doji (like a reversed pin)

The Doji reflects a market that is indecisive and lacks a clear trend. Usually, a Doji is followed by a short price reversal.
Therefore, traders identifying a Doji should open positions targeting the opposite direction of the current price movement. The stop-loss is placed below the lowest Doji price for long trades or above the highest Doji price for short trades.
-
Long Trades: Stop-loss placed below the Doji’s lowest point
-
Short Trades: Stop-loss placed above the Doji’s highest point
The Hammer and Hanging Man candlesticks may signal a possible price reversal.
Hammer Candlestick
After the market has been moving downward for some time, the hammer candlestick opens at the previous close and then drops. As the market refuses to go further down, the candlestick closes higher. This is generally a bullish signal.
Requirements:
This pattern must have a long lower shadow (at least twice the size of the real body) and little to no upper shadow.

Hanging Man Candlestick
Hammer and Hanging Man patterns look identical; the difference is that the Hammer appears after a declining market, while the Hanging Man appears after a bullish market.
-
The Hammer is found at the end of a declining market and is a bullish signal.
-
The Hanging Man is found at the end of a bullish market and is a bearish signal.
Hanging Man Requirements:
Like the Hammer, it must have a long lower shadow (at least twice the size of the real body) and little to no upper shadow.
Stop-loss placement:
-
Long Trades: Stop-loss below the Hammer’s lowest point
-
Short Trades: Stop-loss above the Hanging Man’s highest point
-3– Shooting Star / Inverted Hammer
The Shooting Star pattern is exactly the same as the Inverted Hammer pattern. The difference between the two is:
-
A Shooting Star is a bearish signal identified at the end of a bullish market.
-
An Inverted Hammer is a bullish signal identified at the end of a bearish market.
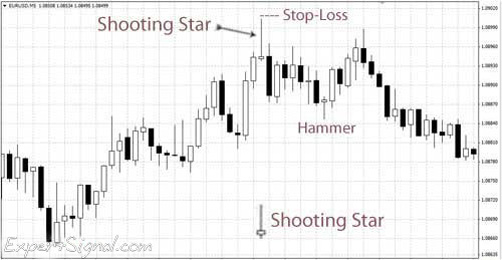
Shooting Star
In a shooting star candlestick, the market opens near the previous close and quickly moves to a new high, then starts to fall, signaling weakness. The Shooting Star indicates an exhausted bullish market that tends to create a trap for buyers. This trap forms as the market reaches a new high and buyers anticipate the continuation of the uptrend, but this expectation proves wrong.
Stop-loss placement:
-
Short Trades: Stop-loss above the Shooting Star’s highest point
Inverted Hammer
For the Inverted Hammer candlestick, the expected market conditions are the opposite.
-4- Morning Star / Evening Star
The Morning Star formation is an early indicator that a declining market is about to reverse.
Morning Star Candlestick
The Morning Star signals a bullish reversal in a bearish market. After a long bearish (red) candlestick, a small star forms, signifying a potential price reversal. The third long bullish (white) candlestick confirms the uptrend. The pattern includes three candles:
-
A long red candlestick in a declining market.
-
A small candle (red or white) that closes below the first candlestick.
-
A large bullish (white) candlestick that opens above the second candle and closes near the center of the first candle’s body.
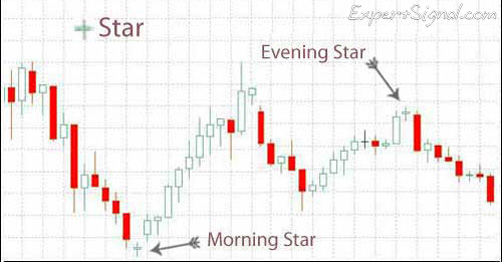
Evening Star Candlestick
The opposite formation, called the Evening Star, occurs at the top of an uptrend and signals that a bullish market is about to reverse.
-5– Harami (Bullish / Bearish Harami)
Harami is a price reversal formation consisting of a large bar followed by a smaller ‘inside’ bar. The word Harami means ‘pregnant’ in Japanese. The pattern involves two candles: the first is large, and the second is smaller and closes within the range of the first candle. Since this two-candle pattern is not highly reliable for early reversal identification, traders often wait for a third confirming candle. This third candle should be an Inside-Down candle (for bearish Harami) or Inside-Up candle (for bullish Harami).

There are two types of Harami patterns: bullish and bearish.
Bullish Harami
Occurs in a downtrend when a large bearish (red) candle is followed by a smaller candle inside its range. The second candle should not move below the first candle’s close and preferably closes above the midpoint of the first candle’s body.
Bearish Harami
Occurs in an uptrend when a large bullish candle is followed by a smaller candle inside its range. The second candle should not move above the first candle’s close and preferably closes below the midpoint of the first candle’s body.
-6– Marubozu (Bullish / Bearish Marubozu)
Marubozu (also spelled Morobozu) is a Japanese candlestick meaning ‘close-cut’ or ‘shaven head and shaven bottom.’ It lacks either a lower or upper shadow, sometimes having no shadow at all, and is usually a large candle.
-
A Bullish White Marubozu opens at its low and closes at its high.
-
A Bearish Red Marubozu opens at its high and closes at its low.
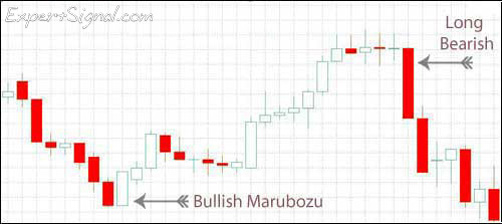
Bullish White Marubozu
In a daily candle, the white Marubozu indicates that buyers were significantly stronger than sellers throughout the trading day, suggesting the buying momentum may continue.
Bearish Red Marubozu
In a daily chart, the red Marubozu shows sellers controlled the market all day, likely continuing the downward trend.
-7- Three White Soldiers / Three Black Crows
Three White Soldiers
This is a bullish pattern formed by three consecutive long white (bullish) candles appearing after a downtrend. Each candle closes progressively higher, opening within the body of the previous candle, ideally closing near the middle of the previous body. This signals a strong reversal from bearish to bullish.
Conditions:
-
The market is in a downtrend
-
Three consecutive long bullish candles appear
-
Each candle closes higher than the previous one
-
The 2nd and 3rd candles open within the previous candle’s body
-
Ideally, each candle closes near the midpoint of the previous candle’s body
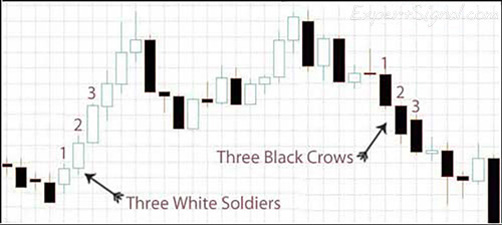
Three Black Crows
This is the bearish counterpart. It consists of three long bearish candles that appear after an uptrend, each opening within the previous candle’s body and closing lower to form a new low.
Conditions:
-
The market is in an uptrend
-
Three consecutive long bearish candles appear
-
Each candle closes lower than the previous one
-
The 2nd and 3rd candles open within the previous candle’s body
-
Ideally, each candle closes near the midpoint of the previous candle’s body
The Three Black Crows pattern signals the start of a bearish market, best trusted on longer timeframes like daily and weekly charts.
-8- Spinning Top (Bearish and Bullish Spinning Top)
The Spinning Top is a reliable, easily recognizable formation, also known as a Reversal Candle. It is common in Forex trading and indicates a potential price reversal, bullish or bearish.
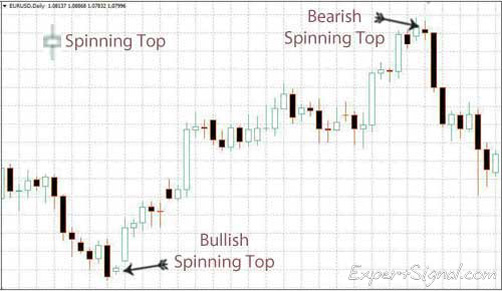
Requirements:
The Spinning Top must have a small body and two shadows significantly longer than the body. The body’s color is less important but ideally aligns with the reversal:
-
White body in an uptrend reversal
-
Black or red body in a downtrend reversal
-9- Railway Tracks or Railroad Tracks (Bearish and Bullish)
Railway Tracks is a strong, reliable candlestick pattern signaling trend reversals. It often leads to significant profits when it appears near major Support/Resistance levels formed by historical highs/lows, trendlines, pivot points, Fibonacci levels, etc.
Traders should look for Railway Tracks only in trending markets, as it is unreliable in ranging markets. It is more reliable on H1 and longer timeframes.

Railway Tracks Formation
The pattern consists of two opposite candles with identical bodies, regardless of their shadows.
Bullish Railway Tracks
In a downtrend, the first (black) candle forms as traders sell. Once selling pressure is exhausted, traders reverse positions, opening longs, forming a bullish candle of the same size.
Bearish Railway Tracks
In an uptrend, the first (white) candle forms during buying. When buying dries up, traders reverse positions, opening shorts, forming a bearish candle of the same size.
Tips when Trading Candlestick Patterns
Recognizing candlestick formations can be especially valuable during periods when traders feel uncertain about the market’s next move. Candlestick patterns often provide early signals of potential trend reversals or continuations, helping traders anticipate changes in price direction. However, relying solely on candlestick patterns can sometimes lead to false signals, especially in volatile or choppy markets. To improve accuracy and confidence in trading decisions, the best approach is to combine candlestick pattern recognition with additional confirmation from other technical tools or indicators.
These confirmation tools may include major support and resistance levels—price points where the market has historically shown strong buying or selling interest—which can validate the strength of a candlestick signal. Similarly, trendlines, which connect significant highs or lows to highlight the prevailing market direction, can help confirm whether a candlestick pattern aligns with the overall trend or signals a genuine reversal. Daily pivot points, which are calculated based on the previous day’s price action, offer dynamic support and resistance levels that traders frequently watch. Fibonacci retracement levels, derived from mathematical ratios, indicate possible areas where prices may pause or reverse, adding further confirmation to the candlestick pattern’s validity.
By seeking such confirmations, traders typically reduce the number of trades they enter, avoiding impulsive or uncertain positions. While this means fewer trading opportunities, the quality of those trades tends to be much higher. This disciplined approach often leads to a significantly improved winning ratio—the proportion of successful trades compared to total trades taken—thereby increasing overall profitability and reducing risk exposure over time.
■ Forex Candlestick Patterns
George Protonotarios, Financial Analyst
for ExpertSignal.com ©


