Defining Oscillators
Oscillators are technical analysis tools that bound within a predefined range. Oscillators are placed below the main chart area and not within the chart area as common indicators.
- Details
- Oscillators
Trading with the new RSI PRECISION v.3 (The first all-in-one Technical Analysis indicator)
![]()
□ Available: TradingView (free indicator)
□ Developer: Giorgos Protonotarios (2021-2023)
RSI PRECISION is an enhanced alternative to the classic Relative Strength Index (RSI) that also functions as a powerful signaling tool. The indicator improves upon the traditional RSI by incorporating PPV (Periodic Price Volatility) to deliver more accurate readings on longer timeframes.
RSI PRECISION v.3 provides five categories of leading trading signals:
-
RSI crosses
-
MACD signals
-
Selected StochRSI signals
-
Golden/Death cross signals
-
Low-high timeframe SMA signals
You can add RSI PRECISION for free on TradingView: » https://www.tradingview.com/script/cTEWnHdU-RSI-PRECISION-v-3

- Details
- Oscillators
Trading with Oscillators

Oscillators are bounded-range technical indicators that help traders determine whether an asset is trading in overbought or oversold conditions. These tools are especially valuable in non-trending (ranging) markets.
Oscillators are useful for:
-
Identifying overbought/oversold conditions
-
Evaluating trend momentum
-
Spotting trend reversals or continuations
-
Generating trading signals
“When a long-term trend loses its momentum, short-term volatility tends to rise. It is easy to see why that should be so: the trend-following crowd is disoriented.” — George Soros
This tutorial provides insights and tips for trading with the following oscillators:
- Moving Average Convergence Divergence (MACD)
- Relative Strength Index (RSI) and StochRSI
- RSI PRECISION v.3 (Multi-Signal Machine)
- RSI PRECISION v.2 (MACD & SMA)
- RSI PRECISION
- Williams %R
- Stochastic Oscillator
- Momentum Oscillator
- Awesome Oscillator (AO)
- DeMarker Indicator
- Average Directional Movement Index (ADX)
- Gator Oscillator (GO)
- Commodity Channel Index (CCI)
- Details
- Oscillators
This is an enhanced version of the popular Relative Strength Index (RSI), specifically tailored for trading cryptocurrencies and tech stocks. The updated oscillator integrates RSI values with key technical analysis signals into a single, comprehensive tool.
RSI PRECISION WITH MACD & SMA SIGNALS (FREE ON TRADINGVIEW)
RSI PRECISION is an oscillator that generates RSI readings by also factoring in price volatility and momentum. Its key advantage lies in delivering highly accurate readings on higher timeframes (monthly, weekly) and during market tops and bottoms. RSI PRECISION is capable of analyzing any volatile financial asset class globally, including Nasdaq stocks and cryptocurrencies.
RSI PRECISION can be used for several tasks:
-
More accurately detect overbought and oversold market levels than the classic RSI
-
Identify RSI support and resistance levels
-
Spot key divergences between RSI slope and price slope
3 Trading Signals:
-
RSI PRECISION Crossovers and Crossunders
-
MACD Crosses (above or below its signal line)
-
SMA Golden Cross & Death Cross (50/200)
■ You can add RSI PRECISION for free on TradingView: » https://www.tradingview.com/v/kBpWBCXU/
Read more: The New RSI Indicator for Crypto and Tech Stocks Trading
- Details
- Oscillators
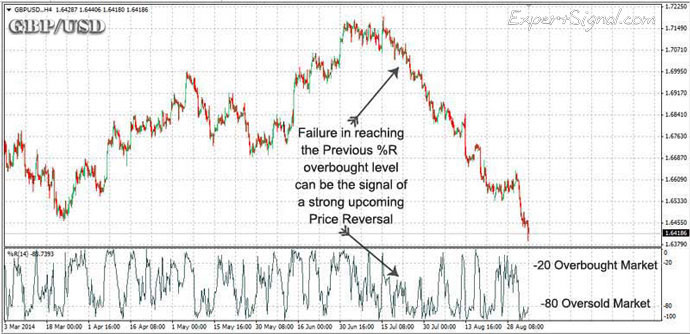
Williams %R
◙ Primary Use: Identifying Overbought/Oversold Market Levels
◙ Trading: Detecting Trend Continuation / Momentum Failures
◙ Standard Settings: 14 Periods
![]() Introduction to Williams %R
Introduction to Williams %R
Developed by Larry Williams, Williams %R is a momentum oscillator widely used for identifying overbought and oversold market conditions, as well as spotting momentum failures.
-
Williams %R oscillates between 0 and -100.
-
It measures the level of the closing price relative to the highest high over a specified period:
-
When Williams %R is near 0, it indicates the price is trading close to the highest high of the lookback period.
-
When Williams %R is near -100, it indicates the price is trading close to the lowest low of the lookback period.
-
-
The Stochastic Oscillator is similar, showing the closing price's level relative to the lowest low (see more under Stochastic Oscillator). (► more about the Stochastic)
-
Williams %R and the Fast Stochastic Oscillator yield the same values, differing only in their scaling.
- Details
- Oscillators
RSI PRECISION -AN ADVANCED VERSION OF THE CLASSIC RSI
Created by Giorgos Protonotarios, RSI PRECISION is an advanced version of the classic RSI indicator, available for free on TradingView. This oscillator enhances the traditional RSI by incorporating market momentum and periodic price volatility.
◙ Primary Use: Identifying Overbought/Oversold Market Levels
◙ Trading: Applicable to any financial market, especially effective for analyzing highly volatile assets (such as cryptocurrencies)
◙ Standard Settings: 14 Periods
□ Add RSI PRECISION on any TradingView chart here, it is 100% free: https://www.tradingview.com/script/irWH8Wkm-RSI-PRECISION/
![]() WHAT IS RSI PRECISION?
WHAT IS RSI PRECISION?
RSI PRECISION is a technical analysis oscillator designed to identify market tops and bottoms across any timeframe. It is user-friendly and enhances traditional RSI readings by incorporating periodic market momentum and price volatility.
- Details
- Oscillators
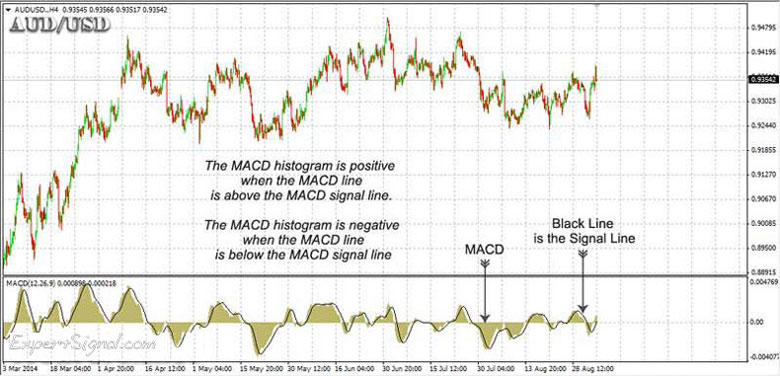
Moving Average Convergence Divergence
(MACD)
◙ Primary Use: Trend-Following Momentum Indicator
◙ Trading: Trading Signals from MACD Crossovers | Slope Divergences (important)
◙ Standard Settings: 12-period Fast, 26-period Slow, and 9-period EMA
![]() Introduction to MACD (Moving Average Convergence Divergence)
Introduction to MACD (Moving Average Convergence Divergence)
Developed by Gerald Appel in the 1970s, MACD is a trend-following momentum indicator and one of the most widely used technical analysis tools worldwide. This oscillator can evaluate the momentum of a trend and generate reliable trading signals.
-
The MACD is the difference between a 26-day and a 12-day EMA (Exponential Moving Average).
-
The Signal Line is a 9-day EMA that acts as a trigger for buying or selling.
-
MACD can be used for trading any financial market (Forex, Equities, Commodities) across multiple timeframes.
There are two main ways to use MACD:
(a) A 2-line system (MACD and Signal Line) that focuses on their interaction.
(b) The MACD Histogram, which highlights crossovers above/below zero.
The MACD Histogram
Developed by Thomas Aspray, the MACD-Histogram shows the distance between the MACD line and the Signal Line.


")